
One Platform.
Two Ways To Finally
Trust Your Data.
Factal answers the questions you ask. Signals surface the ones you didn't know to ask. Use either one on its own, or both together.

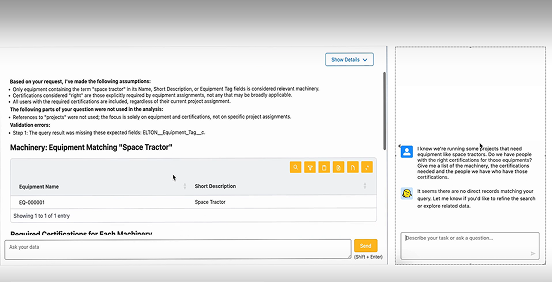


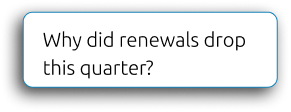
Ask Anything. Get An Answer You Can Verify.
Factal is the conversational layer over your business data. Ask a question the way you would ask a colleague, and Factal translates it into the right query, pulls the real data, does the actual math, and shows you exactly how it got there.
What Makes It Different
The language model is used to understand your question, not to invent the answer.
The numbers come from real queries against your real data.
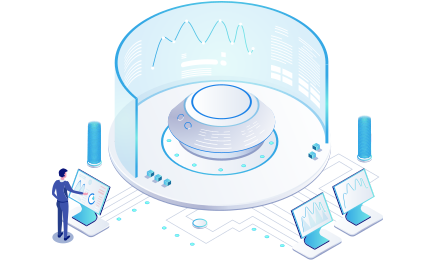
Every Answer Comes With A Visible Trail
The query that ran, the records it pulled, the calculation applied. Built to work without a data analyst in the loop, but analysts can use it too, to move faster on deeper investigations.
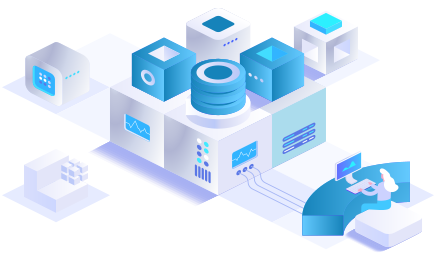
Data Governance In-Built
Admins control exactly what data each user role can access, down to specific records. Every answer Factal gives automatically respects those boundaries. Governance is part of how the product answers, not a separate layer bolted on.
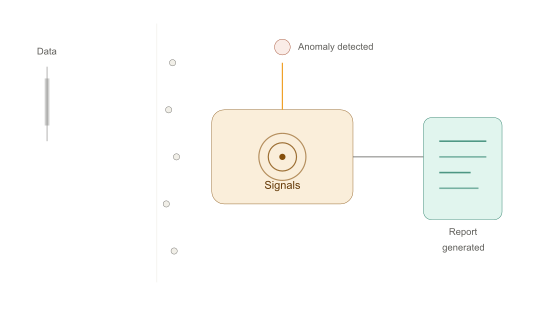
The Questions You Didn't Know To Ask, Answered Before You Asked Them.
Signals run automatically across your data on a regular cadence, weekly by default. It looks for patterns, correlations, and shifts, then stress-tests what it finds. If a pattern holds up, it goes into the report with the evidence. If it doesn't hold up under scrutiny, Signals says so.
The output is a Factal Intelligence Report: a structured executive narrative organized around a strategic question, with numbered insights, supporting evidence, charts, recommended actions, and, where the data is insufficient to conclude, an explicit list of open questions the data cannot yet answer.
What Makes It Different

Proactive, Not Reactive. Signals doesn't wait for a question. It looks for what's changed and flags it. Uses Explainable Boosting Machines to find meaningful correlations in your data, separating real signal from statistical noise.
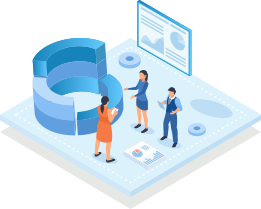
For each pattern found, a conversational analysis is run to confirm or disprove the relationship before it goes into the report. A pattern that doesn't hold up doesn't make the cut.
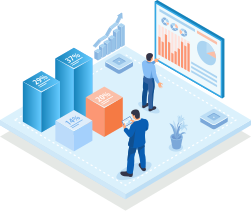
The report separates Working Patterns (confirmed findings), Risk Patterns (things that could be distorting the picture), and Open Questions (what the data cannot yet resolve), so you know what to act on and what to validate first.
Medicare Part D (Public Data)
To demonstrate the method, Factal ran Signals on the publicly available Medicare Part D 2014 prescriber dataset. Signals identified a strategic question worth investigating, what's driving senior prescription volume and where are the biggest opportunities to improve fill rates, and returned four structured insights: which chronic drugs dominate senior fill volume (confirmed by matching fill-to-supply-day ratios); where geographic supply efficiency gaps exist and why they are ambiguous before drug-mix is ruled out why acute-care specialties must be excluded from chronic-adherence benchmarks; and where data suppression above 40% in major specialties creates blind spots that could distort performance thresholds. Each insight came with recommended actions, raw evidence, and explicit open questions, generated automatically, once a week, without a human analyst writing a line.
Built For Business Leaders

Sample Question
Why did pipeline velocity drop this quarter?

What Factal Returns
Identifies which segment, stage, or rep cohort is driving the change, with the underlying query and figures Shown
How It Works

You ask a question or Signals detects a pattern worth flagging.

The AI figures out the intent, what you are really asking, or what changed and why it might matter.

Real queries run against your actual data. The AI doesn't generate numbers from memory or pattern-match a guess. It retrieves real records.

The math (averages, trends, comparisons, etc.) is calculated deterministically, the same inputs always produce the same output.

You see the full trail: the query, the data, the calculation, not just a confident-sounding sentence.
Connects To Your CRM, Database Or
Any Other Tool, Wherever It Lives.








These integrations are live and ready to connect today. If you use a different CRM, data warehouse, or tool,
bring it.
We will get it integrated in a matter of days, not months.
On The Roadmap
Additional CRMs and tools, prioritized by customer demand.